Online supplement:
Two examples of MCS forecasts issued by the PECAN forecast team
1. A less successful forecast
The forecast team expected a high probability for an MCS in eastern KS during the period 06-09 UTC 4 June 2015 Fig. OS1. As it turned out, this HIGH probability was placed too far south, and a false alarm forecast (MDT probability) was issued for an MCS in western NE. Some reasons for the poor team forecast can be seen in a subset of the model guidance available for this case (Fig. OS2). Although the 00 UTC initialized CSU WRF model and the probability matched mean of the 00 UTC initialized NCAR WRF ensemble did suggest the main MCS would be near or north of the KS/NE border, the 00 UTC initialized WRF run had the eastern MCS in KS. The 12 UTC NSSL WRF run did shift the system in the right direction. Regarding the MDT probability in western NE, all model guidance did suggest an MCS would be in or near this region. A small MCS did occur at this time about 200 km NW of the forecasted MDT centroid.
|
|
Fig. OS1: Forecast issued by PECAN team for probability of MCS occurrence during 06-09 UTC on 4 June 2015 with green contour representing LOW probability, red MDT, and pink HIGH. The background shows observed composite radar reflectivity at 08 UTC. (Click on image to enlarge.) |


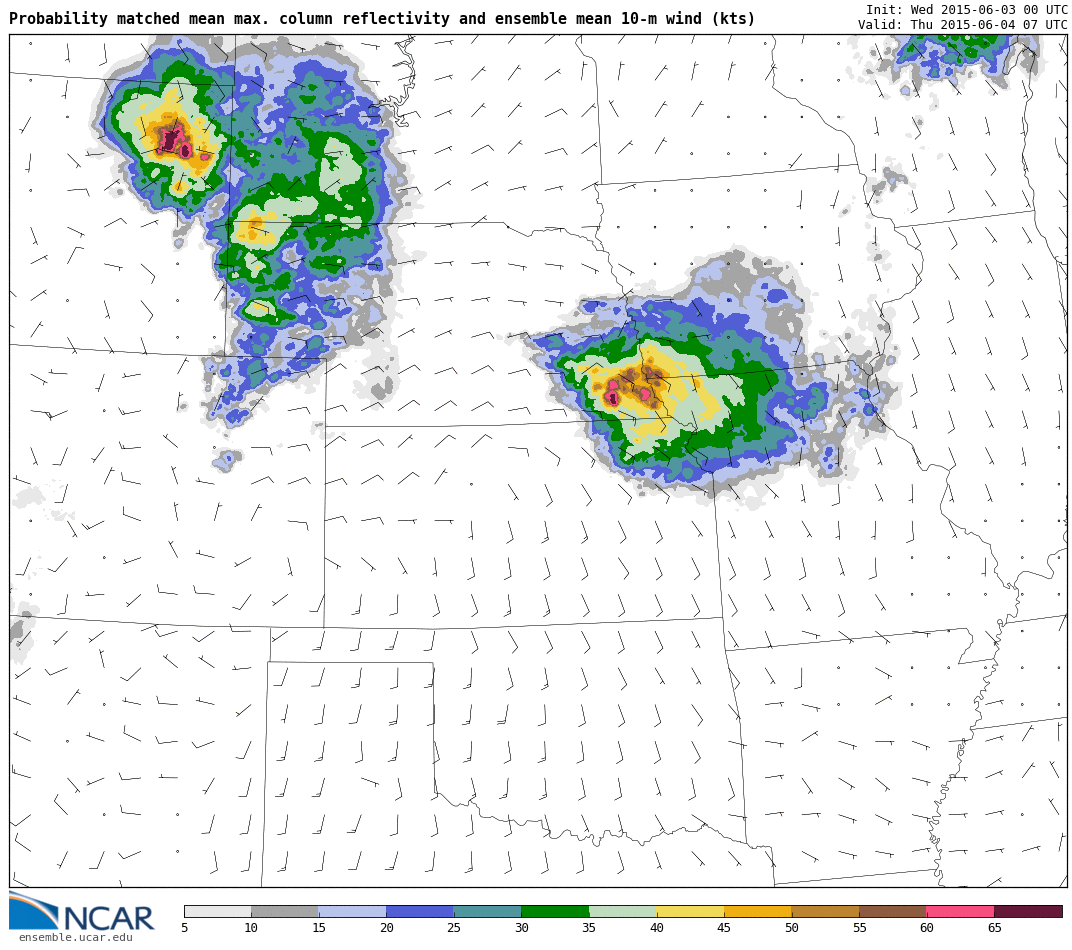
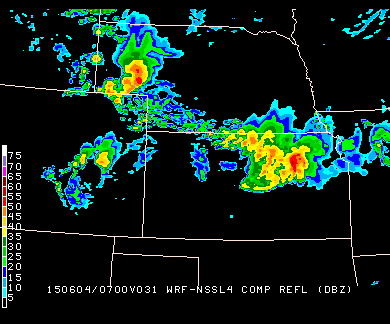
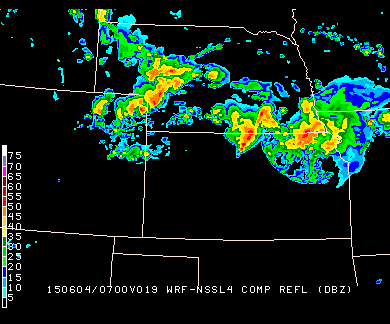
Fig. OS2: Simulated composite reflectivity from the CSU WRF from 00 UTC 3 June (upper left), probability matched mean from 00 UTC 3 June NCAR WRF ensemble (upper right), 00 UTC 3 June NSSL WRF (lower left) and 12 UTC 3 June NSSL WRF (lower right), all valid at 07 UTC 4 June 2015.
2. A more successful forecast
An example of a well-forecasted MCS where displacement errors were much less than in the previous event (and the area of higher probabilities much more covered by convection) can be seen for the 06 July 2015 event (Fig. OS3), which has a strong flow signature at the surface. MCS probability contours in Fig. OS3 are valid for the 03-06 UTC period. At this time, an MCS was organizing and moving into a region where a HIGH probability had been issued. Model agreement was very strong at this time for convection to exist in SD and MN (Fig. OS4), giving forecasters confidence to issue a HIGH probability region (Fig. OS3). In western and central NE, models differed as to the amount of deep convection that would build that far south, so that forecasters felt less confident and issued lower probability categories in that area.
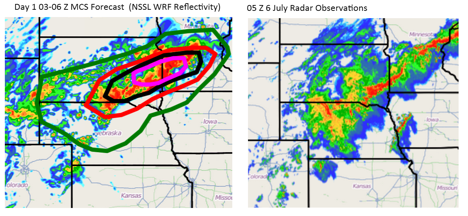
Fig. OS3: Forecast issued by PECAN team (left) for probability of MCS occurrence during 03-06 UTC on 6 July 2015 with green contour representing LOW probability, red MDT, black High-MDT, and pink HIGH. The background of the image shows the simulated reflectivity from a 00Z UTC 5 July NSSL WRF forecast valid at 05 UTC 6 July. On right is the observed composite radar reflectivity at 05 UTC 6 July.
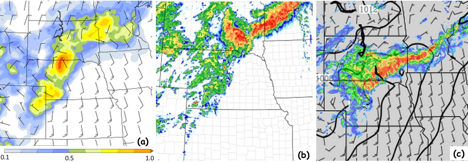
Fig. OS4: (a) Probability of maximum column reflectivity greater than 40 dBZ from the 00 UTC 5 July NCAR WRF ensemble valid for 03 UTC 6 July; (b) simulated composite reflectivity from the 00 UTC 5 July MPAS model valid for 04 UTC 6 July; and (c) simulated composite reflectivity forecast from the 12 UTC 5 July NSSL WRF forecast valid at 04 UTC 6 July.